Blog 13
January 22, 2026
Here we go, another year and another market to navigate. Lots of macro things happening internationally, political tensions brewing in certain states, but our local economy in King County keeps humming along and housing is still very strong.
Mortgage rates:
Rates are at their lowest since September of 2024. Keep an eye on them here. The current Presidential administration has purchased $200B in mortgage-backed securities to stimulate housing. We’ll see how long that keeps rates lower.
Interesting Stats:
The cost of a great education:
How much does it cost to send your kids to the best public schools in the Seattle area? Well, you can rent a home in one of these areas or buy. Alternatively there are private schools which cost between $20k-50k per year for high school, so $80k-$200k in total. The value of sending your kids to these schools is clearly extremely high!
District Median Price Ranking of district on Niche.com
Mercer Island $2,500,000 #2
Bellevue $1,950,000 #1
Lake Washington $1,595,000 #4
Issaquah $1,595,000 #5
Bainbridge Island $1,312,000 #6
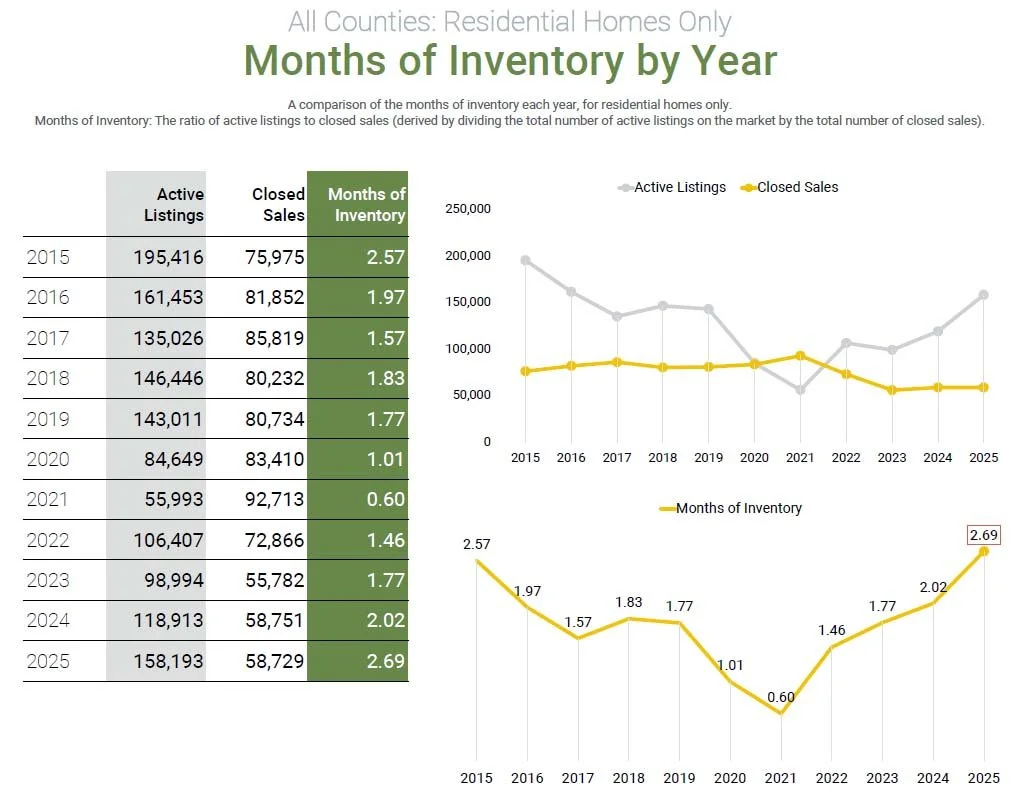
Is it getting easier out there? Stat’s above show that there are more homes available which means the market is more favorable to buyers. Inventory was up 40% last year for homes and condos in King County.
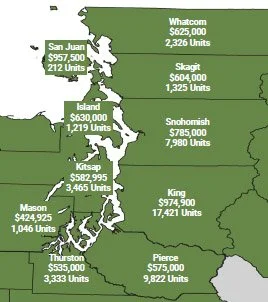
One of these counties shown above is not like the others. Two of the largest companies in the world (Amazon and Microsoft) are headquartered here while Apple, Google and Meta also have a growing presence here. That would be the King of all WA counties, King county. This is why the median home price here is nearly TWICE that of the median home price in the rest of the country and why King County is one of the top 5 fastest growing counties in the country.

Blog 12
March 1, 2025
Well, it's nearly spring time in Seattle. The frogs are starting to chirp and sunbreaks are bringing everything back to life. Everything including home buyer activity. Nearly every year from February to May, the Seattle (area) real estate market heats up. Multiple offers, lines out the door at open houses, waived contingencies all become the norm. And here we are, approaching March of 2025 and all of these things are happening once again.
As an agent, I mentally prepare myself for the battles I know are ahead. <See Ben Afflec smoking meme>. Every (desirable) house that comes on the market is like a piece of meat thrown into a tank of piranhas. I know this. Buyers who have made a few offers and lost know this. But nearly every new buyer I will start working with over the next few months won’t fully understand this until they experience it. It is like a feeding frenzy out there because there just aren’t enough homes on the market to meet the demand. This story is told year after year in Seattle.
So what are buyers to do? Accept reality. If you want a nice house in a nice neighborhood, you will almost certainly have to compete for it against other buyers. That means going above asking price and usually waiving contingencies to improve the offer. If you don’t want to compete, you’ll need to look for a different type of home. Maybe instead of a house you could consider a condo, townhouse, fixer upper, or maybe look in a totally different area. Expecting a 10/10 house in a 10/10 neighborhood for a “deal” is not realistic.
Recent Anecdote:
I just sold a listing that had 45 tours in 5 days, received 5 offers (all over asking price), and went 5% over asking with no contingencies. This is just one example of many recent listings that have had similar activity. It’s not that it’s “crazy” out there, this is just the new normal for spring in Seattle area.
Mortgage rates:
The x-factor happening right now is that mortgage rates are improving. Not by a ton, but enough for people to notice and try to capitalize on this opportunity (¼ point drop). Will rates keep going down? Will they go back up? Keep an eye on it here.
Comparing where we are now to the last 2 years:
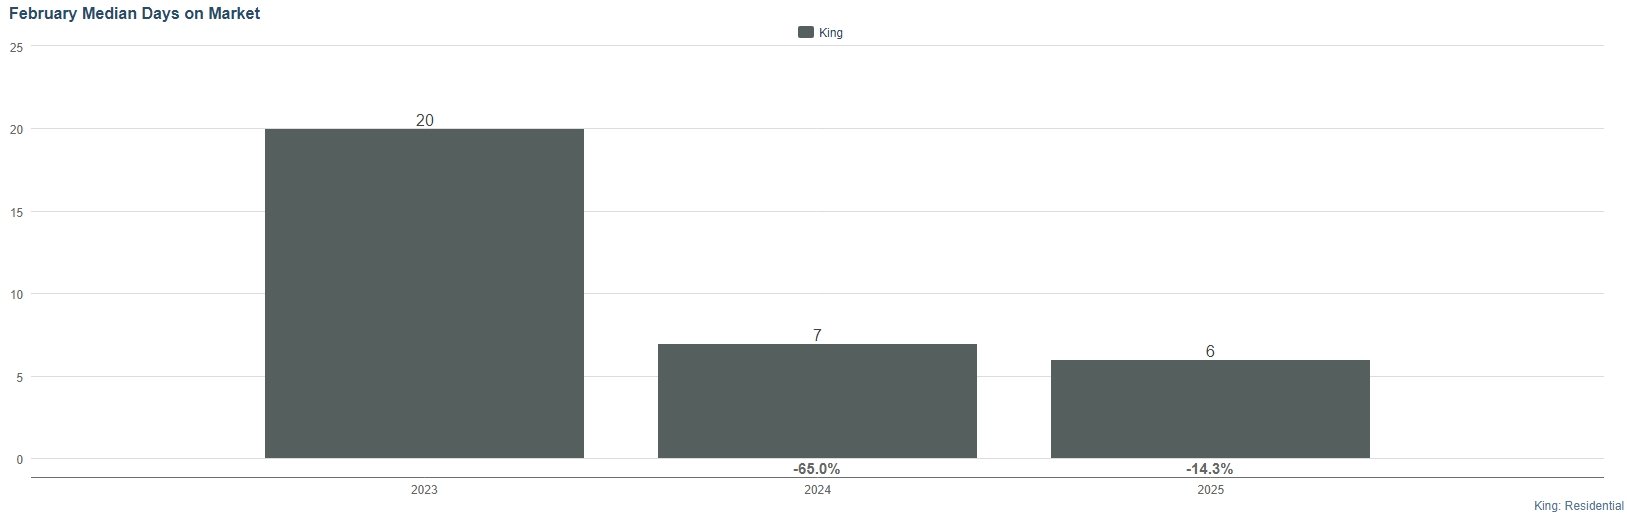
Homes in King County sell in an average of SIX DAYS
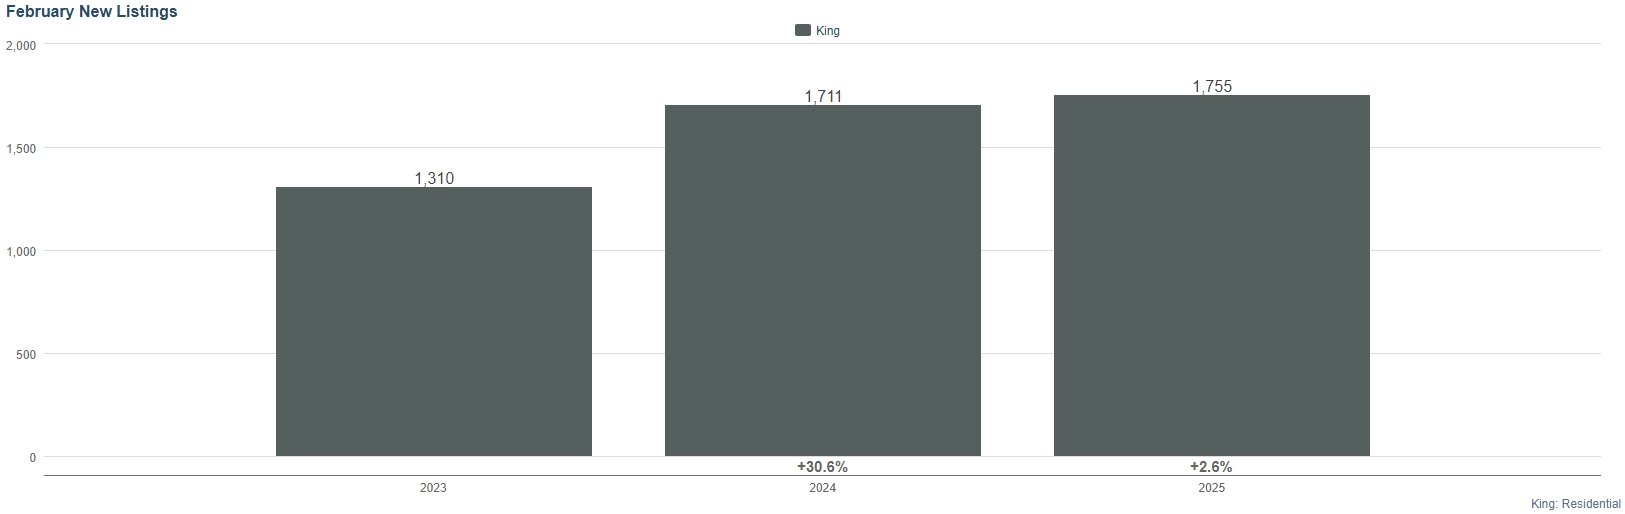
Slight improvement of listings over last year

Buyers are back!
Blog 11
January 15, 2025
2025 is here and rates are not cooperating with expectations. Currently, mortgage rates are hovering over 7% which has a lot of buyers frustrated and waiting for something to change. It was the widely held belief that rates would be steadily lowering along with Fed rates, but behold, bond vigilantes have kept the 10-year treasury note high which in turn has pushed mortgage rates higher. We have sky high US stock market values, sky high real estate values, and an incoming WH administration that promises to disrupt things.
Lets recap 2024 to see where we ended up:

We set a record in median home sale price in 2024 in King County.

Homes available on the market recovered some ground but still well below healthy balanced market.

This is the annual cycle for new listings for past decade. What changed the last two years? Mortgage rates + ultra high prices after covid.

There are way less homes being sold the past two years than the norm. This means there has been a huge slow down for real estate agents and mortgage brokers.

The problem: mortgage rates have made homes substantially more expensive.
Blog 10
January 10, 2024

Well here we are! 2024 has woken up the market and caught a lot of people off guard. The steep drop of rates in November led to a significant increase in activity in December. I saw a lot of homes get multiple offers in December, even some that had been sitting on the market for over a month. Very strange.
It appears that rates will continue to drop this year which will inevitably lead to more more buyers coming out of the woodwork. I am advising all of my clients to get started now in their search. Get comfortable with looking at homes in person every week even if they don’t plan to buy for a few months because come spring, its going to be GAME ON!
Any buyers starting out in April or May had better be prepared for a wild ride!
Blog 9
October 18, 2023

ITS OFFICIAL: mortgage rates are now above 8% for most buyers. This is not good for buyers or sellers. The market has already lost a ton of steam compared to last year. So much in fact, we have the lowest number of sales since 2011 in King County and lowest number of listings since 2006 which is the farthest data goes back in MLS. These are pretty concerning numbers.
An eye opening exercise for current homeowners to play: Plug in your current home value to this mortgage calculator. Plug in the downpayment you used when you purchased your home. Set the rate to 8% and ask yourself if you could afford to buy your home today. The answer should be pretty disturbing!
SO…is it a good time to buy? The answer to that question lies in what your alternative is. My best suggestion is to create a spreadsheet comparing rent payments versus mortgage payments over the next 2-3 years. Sure, the mortgage payment will be higher than rent but the appreciation and tax benefits will start to outweigh renting after the 2-3 year horizon in most cases. For some people it might make sense to keep renting and wait for a better market to buy in. The only concern with that scenario is, when rates do finally come down, many sidelined buyers will return to the market causing prices to increase.
On the charts below are:
1st: New listings per year since 2006 (2023 has had the lowest in this series)
2nd: Closed sales per year since 2006 (2023 has had the lowest since 2011)
3rd: The incredible mortgage rate increase in the past 2 years.


Blog 8
July 14, 2023

Welcome to the second half of 2023. The first half was surprisingly strong and packed a punch. The Nasdaq rallied which boosted our local tech buyers. A full THIRD less (-35%) listings than this time last year created, you guessed it, more competition. More rounds in the ring for buyers and great returns for sellers. The market has been like Rocky Balboa, ducking and dodging everything that’s been thrown at it and delivering knock out punches when you least expect it.
What will the second half bring? Well, unless we see rates go up another point or more, I think buyers have begrudgingly accepted 6-7% rates. The only other foreseeable things that could soften this market would be a “large” stock market correction or a massive increase of new inventory (which the latter is very unlikely). Listings (and sales) traditionally trend downwards from July through year end.
Let’s look at the (crocodile) data:

What you can see above is that it has been a steady seller’s market all year. More homes go pending than get listed every week so the supply never builds up. Most homes sell quickly. That means urgency and competition on most homes. The average days on market for all residential sales in King County is only 16. Sure, that’s double what it was in May of ‘22, but that was the all-time lowest days on market ever. Homes sell quickly if they are priced right and presented well. Most sell at or above asking price.
Comparing the data:
June of 2023 compared to June of 2022:
35% less listings
24% less sales
Median price up 1%
June of 2023 compared to June of 2019:
26% less listings
32% less sales
Median price up 34%

Blog 7
April 16, 2023

Q1 is now behind us and it’s been an interesting ride. As a continuation of the theme of last year, the market is still very influenced by mortgage rates. To explain, I’ve provided two charts below which should make it very clear what’s going on.
The chart above shows new weekly pendings (orange) VS new weekly listings (blue) for residential King County homes. I think this is the best week by week barometer to track the market.

Why the crocodile? Well, I see a crocodile on the graph. And a crocodile fits the temperament of this recent market. Resting, waiting, then explodes and catches you off guard. Then it goes back to resting.
The good news is the jaws on this beast closed a bit this week. The farther the orange line is above the blue line, the more competitive the market is due to too many buyers competing for not enough homes. If the blue line were above the orange line (more listings than new pendings) then things would be slowing down as supply would be greater than demand.
In mid January, the market took off like a rocket and multiple offers were suddenly back after being gone for 6 months. Buyers (and their agents) were caught sleeping if they didn’t get aggressive. Waiving most if not all contingencies, escalating 5-10% over asking and offer review dates were back.
Then you see the listings increased in late February while pending decreased so the market slowed. Why you ask? Look at the rates below and ask yourself if there is a cause and effect? The answer is yes. Right when rates screamed back up nearly a full point in February, buyers let off the gas.
Buyers seem “ok” with rates in the low 6’s and 5’s, but when they approach 7 or beyond…goodbye buyers!

Blog 6
June 14, 2022
Well, it’s time for another update and boy there are a lot of things going on! I just want to put it out there that in this newsletter I am doing my best to present facts, not opinions or predictions.
With so much going on in the world today, many people are oblivious to current market conditions, so my hope is this newsletter brings you some useful information. Now let’s take a look at this complex and developing situation we’re in.

Local headlines (King County Residential):
-Showings significantly down on listings
-Steadily increasing inventory of new listings and homes sitting for longer days on market
-Steadily increasing number of listings with price reductions each week
-Slight decreasing trend of new pending sales each week

These are all significant metrics on their own. But when you mix all of these conditions together? Time to bust out the most overused word of this decade: it’s truly “unprecedented”.

Recent anecdote:
I have a listing in a popular suburb south of Seattle. Good schools, safe neighborhood, less than 20 years old. We listed it mid-May for a reasonable price based on comps with room to go up with multiple offers. This has been the playbook for the past few years. First weekend on the market we had one showing and our offer review date passed with no offers. Two weeks on, one additional showing and fortunately they ended up writing an offer. Sellers accepted that offer at 4% under asking price. Meanwhile there are 10+ comparable homes still on the market within a mile that aren’t selling, many approaching 30 days on market. As I said in my past newsletter, this “new” market will be challenging for sellers as they will be forced to accept lower prices than their neighbor’s sale from just a few months ago.
This is just one data point, but it is a HUGE change from just a few months ago where this house likely would have sold for 10% over asking. It may sound crazy, but it’s as if someone flipped a circuit breaker and the power of the market went out.

What we have right now is a changing cycle, albeit a large one. We are coming out of a cycle where the US economy was effectively given a large dose of steroids to keep it operating through Covid. Now those steroids are wearing off (and clearly, we are dealing with some negative side effects). Local real estate values went up 40+% over the past 2 years. A normal “hot” Seattle market is 7-8% per year.
What could happen moving forward? As Mark Twain said, “History does not repeat itself, but it does rhyme.” To prepare for an unknown future it is helpful to study the patterns of the past. Someone who has done a terrific job with this is Ray Dalio. He presents an incredibly well researched and thoughtful perspective on what has gotten us here (macro picture) and where we are going. You may say, “I’m not going to watch some boring video! I don’t have time for that!” To that, I humbly recommend that you give it a shot. It’s 30 minutes long and makes this murky situation we are in very clear.
Or just take my synopsis of the video at face value: market cycles are inevitable and have occurred since the invention of money. It certainly seems reasonable to expect more turbulent conditions ahead. As a pilot would calmly say, “please remain seated and fasten your seatbelts”.
Blog 5
May 6, 2022
“The will to win means nothing without the will to prepare”
- Juma Ikannga, NYC Marathon winner
Interest rates this week at their highest number (5.64%) since 2008 when the median home price in King County was $430k.
April 2022 median residential home price for King County ticks up to the $1,000,000 mark, the highest ever.
The winds of the local and national real estate market are shifting. If you are a seller, prepare for your home to be worth less than it was earlier this year. Yes, a terrifying thought that prices may come down from absolute highest prices of all time. If you are a buyer on the other hand, prepare to reduce your budget (perhaps significantly) as interest rates are now much higher than just a few months ago.

Mortgage rates are now at levels not seen since 2008 and changing at a pace not seen since the mid-1990s. Why are rates going up? The Federal Reserve is dealing with incredibly high inflation and their job is to cool it by raising interest rates. This rise in interest rates will take time to affect our local market, but it’s not a matter of if but when prices start to flatten if not come down. My guess is the slowdown begins in June and trends downward from there through the rest of the year. I could be wrong though, this is just my opinion!

The spectacular rise in home prices in King County VS the average mortgage interest rates.
What’s ahead for 2022, at a glance:
Average buyer #1 buys a home for $500,000 in February, 2022. He puts down 20% and locks in a loan for 4% which makes his payment $3100/mo. He is ok with this payment and glad to have a house.
His friend on the other hand, buyer #2 was not prepared to buy until summer. He starts looking in June and buys a home in late July. He locks in a rate at 6% (this is a best guess, it could be higher or lower) and puts down 20% as well on an $500,000 home. His payment is $3,600.

Will buyer #2 just eat this extra $500/mo difference for the same house? It is not an insignificant number. To get the same payment his friend buyer #1 got, he needs to buy a house at $430,000 or less. That is massive difference and will lead to a huge adjustment period between sellers expecting astronomical prices and buyers not being able to afford such high prices. Goodbye 10+ offers and bidding $100,000’s over asking. Rates could be at 6-7% or higher by the end of the year (which would put that $500,000 house at $3850/mo which is $750 more than buyer #1 pays).
In my opinion, there is no way prices continue to push to higher and higher levels in this new 5%+ high rate environment. They may for the next month or so as the final lucky buyers with locked rates from March secure homes. What will likely happen is listings will sit and not sell. As they sit, some may sell for asking price, but if they don’t, sellers will have to reduce their asking price to get an offer. Many sellers will be outraged that their house sells for less than their neighbors house (even if their house is much better than the neighbors).
Buyers on the other hand who started looking in January (or earlier) but haven’t been able to find a house will be shocked to realize their new preapproval amount is $100k+ less than it was when they started looking. Worse yet, they won’t be told this by their mortgage broker until after they get a home under contract. Then what happens? The buyer will fail financing (through their financing contingency) and the house will go back on the market and the sellers will be very unhappy. I am already seeing more of these situations than I have in a while.
As this adjustment period plays out, who will win? Sellers who list their home ASAP while prices are still close to all time highs AND buyers that have experienced agents who understand what is going on and can get them a great deal (for the first time in years). In the meantime, many buyers will decide to sit out and “wait” to see what happens. Those that stay in the hunt will watch their buying power decrease nearly every week as rates continue to increase.
Mortgage rates over the past decade:

If it looks like that's the biggest, sharpest move in a long time, that's because it is! You'd have to go back to 1994 to see anything on the same scale, but as of this week, the current move is actually a bit bigger.
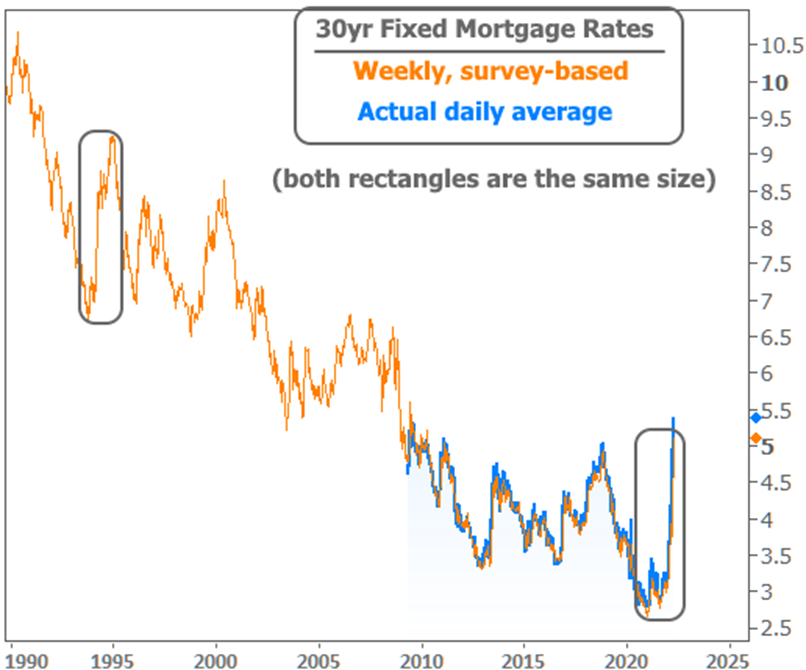
If we look deeper into the past, however, rates have been worse--MUCH worse. (Below)

The inflationary period of the 1970s caused the Fed to raise interest rates to a blistering 19% in the 1980s. Yes mortgages in the upper teens were common for home buyers during that time. How high will our interest rates get over the coming years? Only time will tell. Maybe the Fed reverses course or stops raising rates this summer after the market screams for mercy? This is doubtful, but anything can happen!
As Samuel Jackson said in Jurassic Park, “hold on to your butts”…

Blog 4
April 4, 2022
“The times they are a changing…” - Bob Dylan
Things are changing but that’s ok! The world is always changing, it is not natural for things to stay the same and markets are no different. Let’s look at the factors affecting the market right now:
1. Rising interest rates: If you don’t already know, you will soon once everyone starts talking about it in the 2nd half of this year. Currently interest rates are hovering around 5%. That is up a full 2% from just 6 months ago and 3.5%-4% from a year ago. That is a big difference. For every 1% increase in interest rates, buyers lose 10% of their buying power (through higher monthly payments for the same property). So, we have buyers purchasing power shrinking while home prices are rising.
Eventually something will have to give and I think that will come around May-June of this year when we’ll see a lot of new listings come out which will decrease demand and prices (slightly). Simultaneously interest rates will continue creeping up. All eyes on Q3 this year for being a possible tipping point for things to become more favorable for buyers.

2. Sellers wanting to capture peak prices: If someone is planning to sell in the summer or fall but is hearing on the news that a recession could be coming or that home prices are dropping, they will change plans to list earlier so they can capture a higher price. I’ve had several clients do this this year and it was definitely the right strategy. But what if collectively thousands of people do that in the Puget Sound area? It will be great for buyers I can tell you that much! Keep your eyes on how many for sale signs you see in your neighborhood over the coming months. If it’s a huge increase, you can assume sellers are trying to beat everyone else onto the market.
3. Sellers not wanting to sell because prices are too high to buy: Unless you are moving out of the area, downsizing, or cashing out and going into a rental, selling + buying is no fun. Imagine selling your house and having no options of anything to buy for months because there is no inventory. Then when something becomes available it is so competitive you must pay much more than you budgeted for to win. That’s the reality and this is one of the reasons our market has remained so hot the past few years. The heat of course is from the friction of so many buyers competing with each other on just a few active homes.
4. Looming recession in 2023 and beyond: there are several macro indicators that have signaled a recession is coming. To be fair, there were similar indicators heading into the fall of 2019 then corona virus appeared and changed everything. I am not trying to be a fear monger, but I see a lot of buzz about a potential recession coming from people in financial markets. I’d expect if news stories start coming out later this year about a recession, then we will start seeing it in consumer sentiment (news flash: its already approaching levels not seen since 2008 crash). Also, if mortgage interest rates go into the 6-8% range in Q4, strap in because it will be a very different real estate market heading into 2023.
Moral of the story: if you want to buy this year, wait until you see a lot of new listings later in the year (*if you see lots of new listings). If you want to sell, do it now.
By the numbers:
Median residential sales price by county in March:
You can’t make this stuff up! It used to take a year to see 7% increases
King: $935k up 7% month over month!
Snohomish: $800k up 7% month over month!
Pierce: $559k up 5% month over month!
Median percentage OVER list price homes were selling for by county in March:
King: 11% (new record)
Snohomish: 11% (new record)
Pierce: 5%
Blog 3
February 6, 2022
The oldest house in Seattle?
It’s not in Queen Anne or Capital Hill, it’s at Alki! Originally built by one of Seattle’s original pioneers, David Maynard (AKA Doc Maynard) sometime between 1857 and 1868 (black and white image) when he owned 300 of the surrounding acres. It was sold in 2017 for $550k (shown in beige) and restored beautifully (today as yellow house).


Blog 2
What makes Seattle special? How do we compare to other major cities in US?
January 19, 2022

From 2010 to 2018, Seattle was the fastest growing city in the US. This #1 title has since been handed to Phoenix, AZ.
But what about since Covid, didn’t Seattle implode? No, actually in 2020 we were the fastest growing big city in the United States. People move to Seattle today for the same reasons they did in the 1800s: for a better life, better opportunities and the beautiful environment (if they can handle the rain).

Seattle in 1878 (already a full generation since first American pioneers arrived), population 3,533.

The most recent time you could say the population was stable was in the early 1980s.
Why do people move here when it rains all the time? The rain may actually be the one thing keeping people away! People move here because of the great jobs, opportunity, education, and quality of life.
Seattle has the 35th highest GDP in the WORLD.
Washington State has the 8th highest per capita income in the United States @ $64k per year.
The average tech salary in Seattle is #2 in the United States, where workers earn an average of $158,000 per year.
Seattle/Tacoma/Bellevue metro area has the 3rd highest per capita income in the United States.
Washington State ranks as the 10th most educated state in United States.
Seattle/Tacoma/Bellevue metro area has the 8th highest education in the United States.
Seattle ranks as the 10th best city for quality of life in the United States.

Amazon’s explosive growth has certainly changed the Seattle landscape but look at all the other major companies in downtown Seattle. Google, Apple, Microsoft and Amazon are the four LARGEST companies in the world by market cap and all have office space downtown.
Blog 1
2021: A Year of Shattered Real Estate Records in Seattle
It’s common knowledge that the local real estate market went parabolic in 2021. As if it wasn’t hard enough to buy a home before the pandemic, conditions became chaotic since the arrival of Covid-19. Buyers at all price points pulled their hair out trying to find a home while sellers watched their homes sell for absurd prices with no contingencies.
What caused this ultra-hot market? Were there just fewer homes on the market because of the pandemic? Was it a delayed demand from 2020 stay-at-home mandates? Did buyers simply have more money from the record-breaking stock market?
There were clearly many factors at play but I think the stats tell the story better than my opinion can. In the graphs below, I look at data from all King County residential sales. The data is clear, 2021 was a year like no other.

(King County: Active months of inventory)
As far back as the MLS data can go, homes have never sold more quickly than they have in 2021. The month’s supply of homes as of December 2021 is 0.6, meaning it would take just over 2 weeks to sell every single residential home in King County.

(King County: Number of new listings by year)
When comparing the overall number of new listings for 2021, it is surprising to see the number is actually within the norm compared to the past 8 years. If the supply was the same, then it must have been a huge lift in demand.
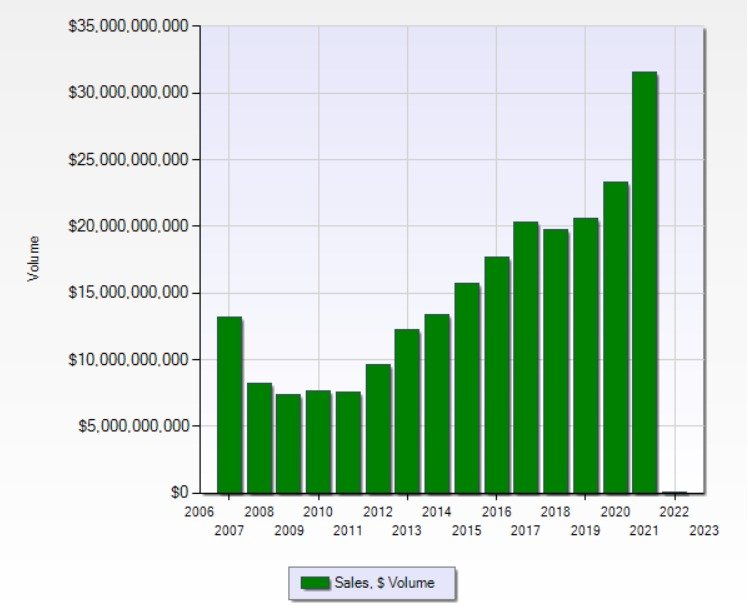
(King County: Number total volume of sales by year)
No other year brought such a significant jump from the previous year. In 2021, thirty-one BILLION dollars worth of real estate was sold, which was up a full 34% from the previous year of $23B. Over 3x more than 10 years ago!
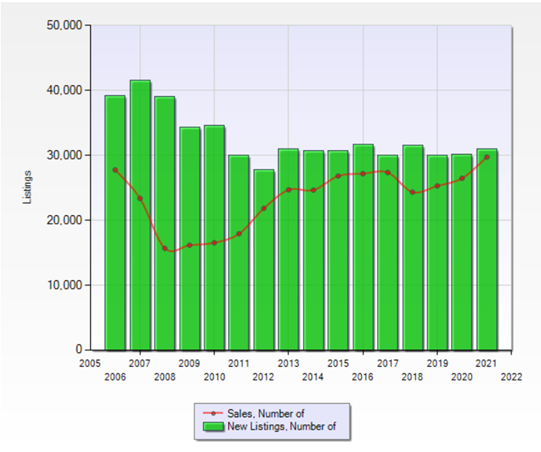
(King County: number of sales per year VS new homes listed)
Sales superimposed on new listings to show how tight the inventory has been. Only 1,213 listings in King County didn’t sell in 2021 or roughly 4%. That means 96% of the total 30,966 homes listed in King County sold – all within a median of 6 days. If a home didn’t sell, we can assume there was a good reason.

(King County: median days on market until pending)
Since the pandemic began, days on market have dropped to the shortest time on record. Some months as short as 5 days until pending!
Notice all of the peaks? Those are almost all the month of January when the market has slowed from the holidays and starts to pick up again for the year. Notice there was no reset in Jan 2021, because buyers never let off the gas looking for a home.
(King County: average list price for a residential home)
For the first time ever, the average list price eclipsed the $1M mark.

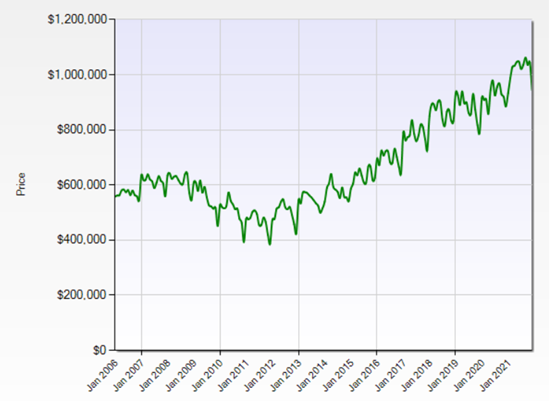
(King County: median sales price for residential homes)
May brought a record median sales price of $875,000 which lowered since then to $820,000. In December of 2011, the median sales price was $317,000, a 158% difference.
Disconcerting stats for the average first time buyer:

(King County: number of residential listings priced under $400,000 per year)
King County median family income (per 2019 US Census) was $94,000 or roughly $5800 a month after taxes. A $400,000 house with $20,000 down costs $2,200 a month or 37% of the median income.
There were a total of 571 homes in 2021 priced under $400,000 which is a 96% decrease from ten years ago.

(King County: number of listings VS sales of homes under $400k)
If you bought a home under $400k between 2010 and 2014, odds are that you are very happy with your decision as you sit on a lot of equity. Since 2015, it has been extremely difficult for the average buyer in this price point. 2017, 2019, 2020 and 2021 demonstrate how high the demand has been with virtually everything being bought up.
Just for fun luxury stats:

(King County: number of homes sold over $2,000,000)
A dramatic rise in homes over $2M, 2x as many as in 2020. 4x as many as 2016, just 5 years before.

(King County: number of homes sold for over $5,000,000)
Again, a dramatic rise in homes sold over $5M, also 2x as many as in 2020. 4x as many as in 2016, just 5 years before. This price point was very competitive in 2021. Multiple waterfront homes on Lake Washington sold for $1M over asking price, one house on Mercer Island went $1.6M over the original price.

(King County: number of homes sold for over $10,000,000)
The ultra-wealthy made a lot of moves in 2021. More homes were sold over $10M in 2021 than in years 2011-2017 combined.
Takeaways:
Inventory in 2021 was within the norm of previous years, so it’s really a misnomer to call it “low inventory”. What appears to have happened is more buyers entered the market with more money which in turn created the ultra-hot market. In other words, more fisherman with better gear lined the banks to catch the same amount of fish in the river.
What caused so many buyers to enter the market? Clearly the pandemic was the major X factor. The pandemic caused a large population of people spend more time at home (under stay-at-home mandates and working from home) which combined with incredibly low interest rates created a tidal wave of new buyers in the market.
Unless we see a dramatic rise in new listings in 2022, the market should continue to stay tough for buyers because there will still be too many buyers and not enough homes through Q1-Q2. Those buyers who struck out in Q4 of 2021 will have a head start in 2022 (because they understand what is required to win) while new buyers entering the market will claim “everything sells so fast for way over asking!”.
The market has become increasingly difficult for buyers overall since 2012 with the only break being 2018. 2018 brought relatively high mortgage rates above 5% and a stock market dip which cooled the market. Home prices in King County dropped by 12% from spring to fall that year. Also to blame that year, buyer fatigue. Sound familiar?
On our horizon for 2022: several rate adjustments from the Fed which will likely increase mortgage rates and cool the stock market. A cooler stock market will mean less capital for buyers to tap into for their home purchases. Hopefully that will translate into less sky-high escalations on homes. Covid-19 turns 3!